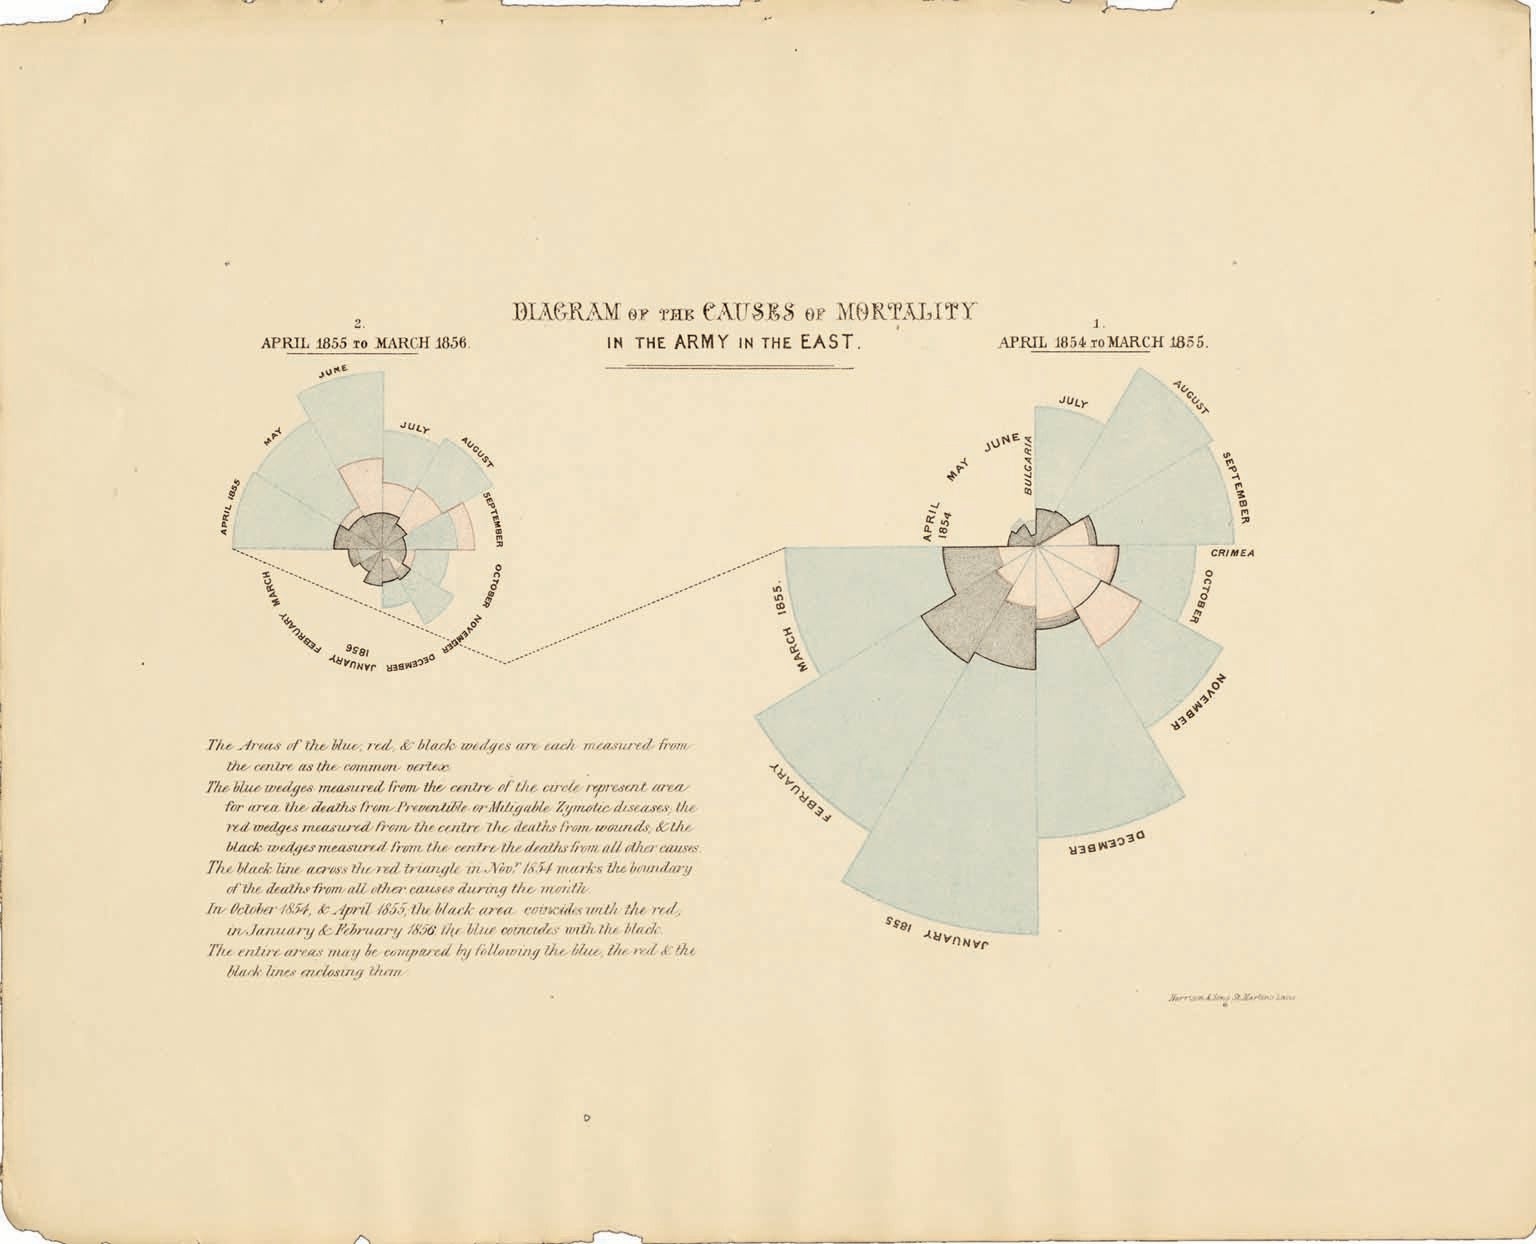
Diagram of the causes of mortality in the army in the East by Florence Nightingale, 1858
This image is of Florence Nightingale’s 1858 “Diagram of the Causes of Mortality in the Army in the East.” Nightingale is known for her contributions to nursing, her Crimean War service, and her reform of hospital sanitation standards. A key aspect of her strategy to drive reform was her use of data visualization. The diagram, or coxcomb chart, illustrates mortality sources across two data sets. First, preventable diseases (blue) far exceeded combat wounds (red) as the cause of death. Second, overall mortality decreased between the first and second years of the war (Scientific American).
Nightingale observed failures in the hospital system such as shortages of medical supplies, overcrowding, and unsanitary conditions. Furthermore, leadership viewed casualties as inevitable, partly due to poor mortality data. To combat this, Nightingale systematically compiled data, collaborated with prominent statisticians, and launched a campaign aimed at Queen Victoria and Parliament. The campaign emphasized the need for public health interventions, including improvements to air quality, clean sewage systems, and reduced overcrowding (Scientific American)(McGill).
By translating dense numerical values into visually compelling diagrams, Nightingale made complex statistical arguments accessible to policymakers (McGill). Her visual representations demonstrated that many of these deaths were preventable. These diagrams aided legislative debate, leading to more standardized data collection and influencing the Public Health Act of 1875 (Scientific American).
Similarly, sociologist and civil rights leader W.E.B. Du Bois developed infographics for the 1900 Paris Exposition in which he combined sociological data and design to articulate Black socioeconomic progress and refute racial stereotypes (W.E.B. Du Bois Data Portraits). Both Nightingale and Du Bois demonstrated how technical information, when translated into thoughtful visual design, can influence public discourse and mobilize reforms.
Sources:
https://www.mcgill.ca/oss/article/how-florence-nightingale-used-data-visualization-save-lives
https://static.scientificamerican.com/sciam/assets/Image/scientificamerican0822-78-I8.jpg